QSA260 Project Management Report Assignment: Gantt Chart & Precedence Diagram Application for Merdeka 118 Landscape Works

School

UNIVERSITI TEKNOLOGI MARA

*We aren't endorsed by this school

Assignment Type

Group Assignment

Subject

QSA260 Construction Project Management

Uploaded by Malaysia Assignment Help

Date

05/15/2025

QSA260 Assignment 1: Project Planning Report

Assignment Outcomes:

To CONSTRUCT project planning proposal using fundamental techniques in the construction project management field. (P4)

Instructions to Students:

  1. This assignment is to be done in a group of 3 students.
  2. All submissions must be in ENGLISH.
  3. Delay in submission shall be treated as NON-SUBMISSION.

QSA260 Merdeka 118 tower

The Task:

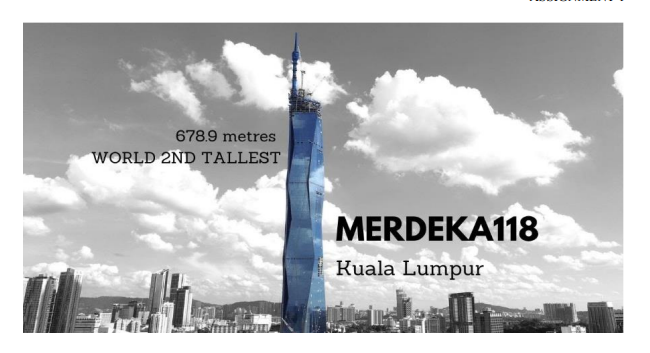
Merdeka 118 tower, in Kuala Lumpur ranks as the second-tallest building in the world and the tallest in Southeast Asia, standing at 678.9 metres with a multi-faceted diamond-shaped façade and unique spire design. Its form was inspired by the outstretched hand gesture made by Malaysia’s first prime minister in 1957, when he declared the nation’s independence in Stadium Merdeka, which is part of the Merdeka 118 precinct. The Merdeka 118 Tower site area was 76,000 m2 consist of 118 floors, the podium floors will be used by retail stores or a shopping mall, above it will be used as office space the 80 floors of the building, 60 of those 80 floors of office floors will be reserved to serve as the headquarters of Permodalan Nasional Berhad.

“Gantt charts show the schedules interspersed on a timeline, while precedence diagrams use network diagrams to show a project’s tasks and how they connect. Both planning techniques show who’s responsible for scheduled activities for Merdeka 118 Tower. Based on the above statement, explain the application of Gantt chart and precedence diagrams for project planning and how both planning techniques could collaborate with each other.

The table below shows 10 major activities as a project planning proposal to show the sequences of the external landscape works project activities. The external landscape works start date is on 1 January 2022.

Stuck in This Assignment? Deadlines Are Near?

ACTIVITY PREDECESSOR ACTIVITY DURATION (WEEKS) CONSTRAINT
A 8
B A 7 Starts 4 weeks after “A” has started.
C A 2 Starts 5 weeks after the completion of “A”.
D A, B 10
E C 15
F B 20 Starts 8 weeks after “B” finished.
G E 4
H D, E, F 18 Starts 7 weeks after “E” has completed but cannot finish until 3 weeks “F” has completed.
I H 20
J I, G 23 Starts 2 weeks after “I” has started.

Based on the information above, prepare the following:

  1. Application of Microsoft Project software for each activity given by using the Gantt chart and precedence diagram technique.
  2. The date of project completion time.
  3. Discuss 5 key features and functions of project management software in the construction project.

REPORT REQUIREMENTS

Kindly note that the report must be prepared and compiled in PDF file format in Times New Roman (12 font) 1.5 spacing and must be in numbering system. The report is to be submitted hardcopy and softcopy to your respective lecturer. Make sure that your report follows the rubrics given below.

ASSESSMENT RUBRICS

WRITTEN REPORT ASSIGNMENT (100 marks) – Reduce to 20%

1. Introduction = 5 marks

a. Exemplary – 5 : Insightful introduction on the purpose of the project report, with examples.
b. Excellent – 4 : Insightful introduction on the purpose of the project report.
c. Good – 3 : Clearly introduced on the purpose of the project report.
d. Average – 2 : Project report is introduced and somewhat introduced.
e. Poor – 1 : Project report is introduced and somewhat is irrelevant.
f. Very Poor – 0 : No introduction.

2. Definition Gantt Chart and Precedence diagram = 15 marks

a. Exemplary – 13-15 : Insightful definition on the topics, with examples of current issues.
b. Excellent – 10-12 : Insightful definition on the overview of the topics.
c. Good – 7-9 : Clearly definition on the overview of the topics.
d. Average – 4-6 : Definition on the topics is introduced and somewhat introduced.
e. Poor – 1-3 : Definition on the topics introduced and somewhat is irrelevant.
f. Very Poor – 0 : No definition on the topics.

Get 30% Discount on This Assignment Answer Today!

3. Microsoft Project Software application (Gantt Chart & Precedence Diagram) = 30 marks

a. Excellent – 25 – 30 : All 10 activities and all calculation are correct application in the software. Discussion comparison analysis are presented.
b. Good – 19 – 24 : 8 – 9 activities and/or 3 calculation are correct application in the software. Discussion comparison analysis are presented.
c. Average – 13 – 18 : 6 – 7 activities and/or 2 calculations are correct application in the software. Discussion comparison analysis are presented.
d. Satisfy – 7 – 12 : 4 – 5 activities and 1 calculations are correct application in the software. Discussion comparison analysis are presented.
e. Poor – 1 – 6 : 1 – 3 activities are correct application in the software. Discussion comparison analysis are presented.
f. Non-compliance – 0 : No project planning are implementation in the project management software.

4. Discussion (ii-iii) = 20 marks

a. Exemplary – 17-20 : Discussion items iii-vi are presented outstandingly clear, effective and logical. Smooth flow of ideas and expression with no errors.
b. Excellent – 13-16 : Discussion items iii-vi are excellent presented effective and logical but not in logical manner.
c. Good – 9-12 : Discussion items iii-vi are good presented but not in logical manner.
d. Average – 5-8 : Discussion items iii-vi are moderate presented but not in logical manner.
e. Poor – 1-4 : Discussion items iii-vi are poor and not clearly reflected.
f. Very Poor – 0 : No appropriate discussion were made.

5. Conclusion = 5 marks

a. Exemplary – 5 : Conclusion is presented outstandingly clear, and demonstrated the ability to related to the whole work to course outcome.
b. Excellent – 4 : Conclusion is presented clearly, and demonstrated the ability to relate to the introduction part of the work.
c. Good – 3 : Conclusion is presented clearly.
d. Average – 2 : Conclusion is moderately presented.
e. Poor – 1 : Conclusion is irrelevant.
f. Very Poor – 0 : No conclusion is presented.

6. References = 5 marks

a. Exemplary – 5 : more than 7 references from various sources and references is presented with APA citation format, and cross referred to the whole work.
b. Excellent – 4 : 5 – 6 references is presented with APA citation format, and/or not all are cross referred to the whole work.
c. Good – 3 : 3-4 references is presented with APA citation format, and/or not all are cross referred to the whole work.
d. Average – 2 : 1-2 references is presented with APA citation format, and/or not all are crossed referred to the whole work.
e. Poor – 1 : Reference is presented with poor format, and/or not all are cross referred.
f. Very Poor – 0 : No references is provided.

7. Organisation of report = 10 marks

a. Exemplary – 9-10 : Observation results are presented outstandingly clear, effective and logical. Smooth flow of ideas and expression.
b. Excellent – 7-8 : Observation results are presented clearly and logically
c. Good – 5-6 : Observation results presented clearly
d. Average – 3-4 : There is moderate attempt to present the observation results clearly, effectively and logically.
e. Poor – 1-2 : Poor organization on observation results.
f. Very Poor – 0 : No appropriate organization were made.

8. Peer assessment (Individual marks) = 10 marks

a. Exemplary – 9-10 : Exemplary in participation in the project report with fulfilment of his/her roles tasks.
b. Excellent – 7-8 : Excellent in participation in the project report with fulfilment of his/her roles and tasks.
c. Good – 5-6 : Good in participation in the project report with fulfilment of his/her roles tasks.
d. Average – 3-4 : There is moderate in participation in the project report with fulfilment of his/her roles tasks.
e. Poor – 1-2 : Poor in participation in the project report with fulfilment of his/her roles tasks.
f. Very Poor – 0 : No participation

Total = 100 marks

Get Solved Your Assignment( variable) and Earn A+ Grade!

Get Help By Expert

Are you stressed due to preparing Project Management Report ? Then don't take stress! Malaysia Assignment Help provides you with AI-free and high-quality assignments. Our PhD-qualified writers also provide free assignment samples for students that you can read to know the quality and structure of your report. Hire a report writing helper and assign your report writing task to them!

Answer

UP TO 15 % DISCOUNT

Instant Paper Writing Services by Native Malaysia Writers

Plagiarism Free Solutions
100% Original Work
24*7 Online Assistance
Native PhD Experts
Hire a Writer Now
Convincing Features
Plagiarism Free Report
On-Time Delivery
Native Writers
A+ Quality
100% Confidential
24*7 Online Assistance

Get these features included in Your Assignment

Get Assistance for Assignments, online Exam, and Projects Writing