Write a report of at least 2,000 words, excluding references and appendices.
Use APA referencing style.
There must be a minimum of 10 references to be used for this assignment.
Formatting: [Times New Roman], [size 12], [1.5 spacing], [justified alignment].
Submit your assignment by 25 JANUARY 2026
Please email your assignment (Microsoft Word format) to academic@sea.com.my
Include a cover page, table of contents, and reference list.
Plagiarism – It is important to note, that your essay is entirely your own work. Students found guilty of plagiarism or collusion faced penalties. It is essential that you understand and follow standard procedures for referencing other people’s work.
Penalty for late submission:
Due Date
Late Submission (1)
Late Submission (2)
25 January 2026
26 Jan to 1 Feb 2026
40% deductions
After 1 Feb 2026
Will not be accepted and will be awarded a “0”
ASSIGNMENT TASK
Using Excel for Predictive Analytics in Finance
MBA7233 Assignment Task
You will use the provided dataset in Excel to perform the following tasks
Subtask 1: Data Analysis and Visualization
a. Use Excel functions to clean and analyze the dataset.
b. Create visualizations (charts or graphs) to show trends or patterns in the data.
Rule No.1 => PLEASE DO NOT CHANGE THE DATA PROVIDED IN THE EXCEL PROVIDED
Clean and analyze means that you can massage the original data to make it cleaner and presentable format.
The visualization is crucial which means you can produce visual output using Excel. Just imagine you want to present the data on the pattern and trend to the management team, how would you present the data visually.
You can use chart, graph, etc depending on your creativity
You will need to explain the data output based on your visual data to provide a clear picture on the data interpretation (focusing on pattern and trend of data)
Subtask 2: Prediction Using Regression Analysis
a. Apply linear regression using Excel
b. Predict a financial outcome (e.g., stock price, sales revenue, or loan approval likelihood).
c. Interpret the regression output.
For this part, you need to use the ORIGINAL DATA to produce a regression analysis model.
The hint is that the sales revenue will be your dependent variable (DV) and the remaining data can be used to become independent variable (IV)
Produce the regression model output (using Excel) => NOT USING AI TO HELP YOU TODRAW
Use the regression analysis to draw your regression model (If you do not have the data analysis function in excel, please do add in the function)
Provide relevance discussion on the regression model function. (Remember to show your regression equation.
Bonus part => you can include some external data to produce some additional analysis (optional)
Subtask 3: Assessing Prediction Quality
a. Calculate and interpret metrics to evaluate the accuracy of the predictions:
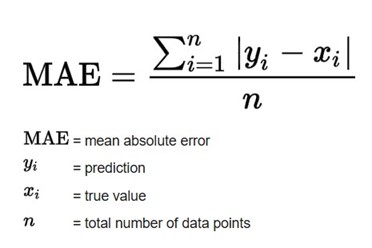
i. Mean Absolute Error (MAE).
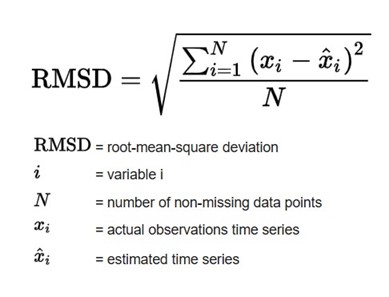
ii. Root Mean Square Error (RMSE).
b. Discuss the implications of these errors in the context of the dataset.
Formula for MAE
Formula for RSME
You need to use the prediction vs actual data output for this question
The original data will represent the actual data and the regression model can be reference to the predicted numbers
Use the regression model or equation generated to generate the prediction numbers.
Using that numbers to compute your MAE and RSME using the formula above (using excel)
Then from the output, you need to provide adequate discussion on the output.
Subtask 4: Scenario Analysis
a. Perform a “What-If” analysis using Excel.
b. Discuss how changes in input variables influence predictions.
For this question, the what if analysis is similar like sensitivity analysis for the output
The analysis will help to understand different potential outcome for the study
For basic level, you can perform three scenario analysis which is from the worst, normal and good (pessimistic, neutral, optimistic) to generate the impression on the scope of prediction
The main idea here is to assess the risk and uncertainty for the potential different outcome to be achieved.
For advance level, you can generate multiple scenario and understanding the potential risk for the different variable input (which represent the uncertainty)
With this, you will be able to analyze the risk like percentage to earn the profit or requirement to breakeven and so on.
Please do discuss your outcome based on the output you obtain.
Subtask 5: Skill vs. Luck in Predictions
a. Reflect on the accuracy and limitations of the predictions made.
b. Discuss the potential roles of skill and luck in influencing the results.
For this part, write essay format for both question a and b.
Explain the meaning of accuracy and the limitations that could occurred from the prediction made (in other words, prediction is not always perfect and accurate)
Then link to the roles and skill and luck in predicting the results (skill using ability and experience to understand the potential outcome, luck is unpredictable and uncertain which is not realistically considered under data analytics.
END OF QUESTION
Facing Difficulty with MBA7233 Managerial Business Analytics at JUC?
MBA students at JUC often struggle with MBA7233 Managerial Business Analytics because tasks like Excel-based regression, MAE, RMSE, and scenario analysis can be confusing and time-consuming. With tight deadlines and strict APA requirements, completing this assignment accurately becomes even more challenging. There is no need to worry, as Malaysia Assignment Help provides reliable Business Analytics Assignment Help in Malaysia aligned with JUC MBA academic standards. For confidence and trust, students can also review our business assignment samples. Order your MBA7233 assignment today through our online assignment help service and receive a 100% original solution written exclusively for you.
Answer
UP TO
15
%DISCOUNT
Instant Paper Writing Services by Native Malaysia Writers